Sunrise and Sunset

astronomy
sunrise
sunset
day length
horizon angle
R
Published

January 14, 2024

Run rising in the White Mountains

Introduction

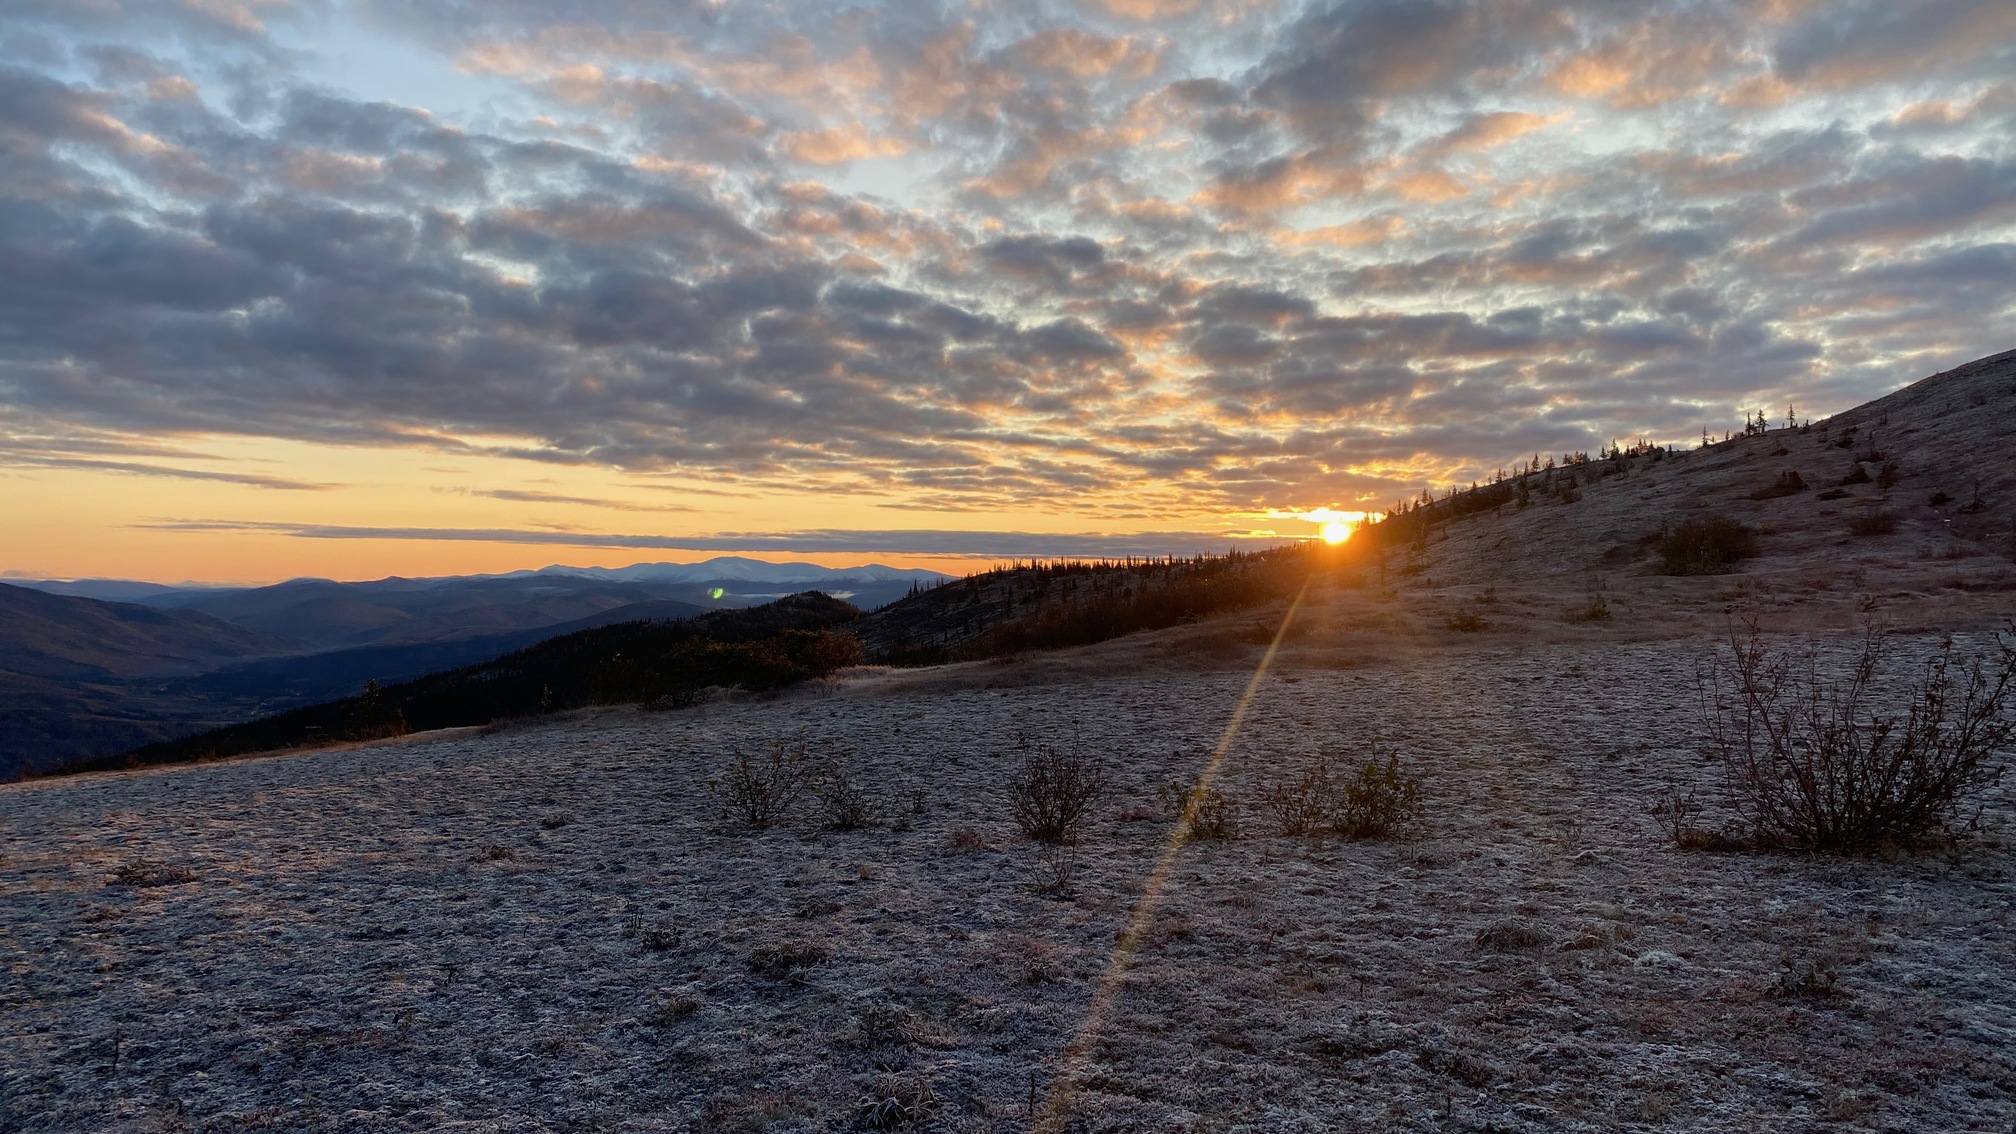
This is the time of year at our house where the sun starts peeking back over Miller Hill in the early afternoon, and direct sun starts hitting the house again. There’s a week where we get sunlight in the upstairs windows, but none downstairs and it feels momentous when we finally get direct sun throughout the house again.

The position of the sun at any location on a smooth, hypothetical representation of the earth is well known, but so much of when the sun actually rises at a particular place depends on the local topography in relation to the sun in the sky. This is a particular issue when camping in the mountains because at elevation the temperatures drop quickly as soon as there is no longer direct sunlight where you are. When we’re backpacking, we use an app called PeakFinder, which does these calculations and shows you the location and estimated time the sun (and moon) will rise and set at your location.

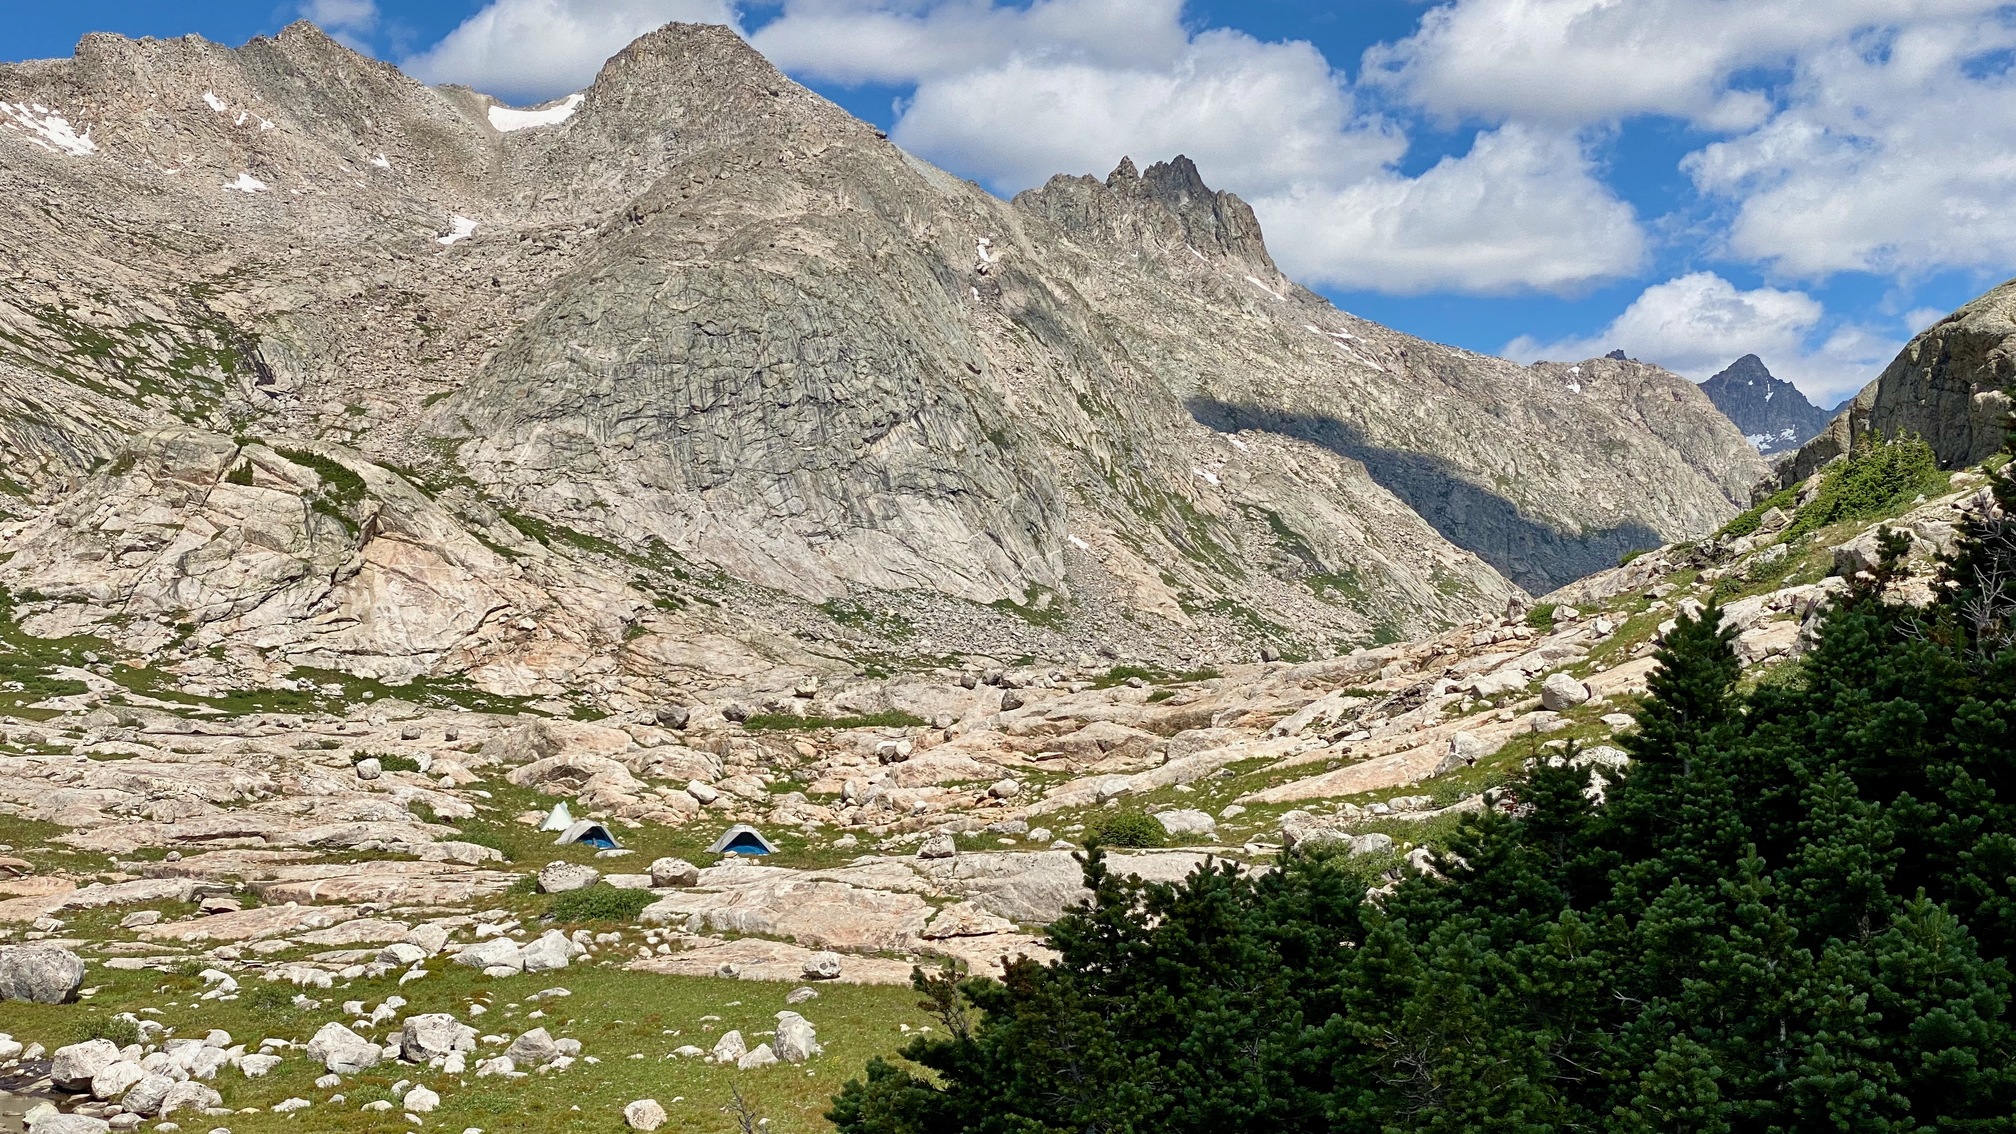
Last summer’s campsite at Titcomb Basin in Wyoming’s Wind River Range is a good example. There were pretty much mountains in all directions.

Campsite, Titcomb Basin, Wind River Range

Sunrise and Sunset

The first step in figuring out when the sun rises and sets is getting the position of the sun. We’re using the suncalc R package to calculate the solar parameters for sunrise, sunset, and solar noon (when the sun is highest in the sky).

You can click the “Code” arrow below to see the R code.

Code
library(tidyverse)
library(glue)
library(purrr)
library(suncalc)
library(gt)
library(gtExtras)

rad2deg <- function(rad) {
  return(rad * (180 / pi))
}

min_to_hhmmss <- function(minutes) {
    hh = floor(minutes / 60.0)
    min = minutes - (hh * 60)
    mm = floor(min)
    seconds = (min - mm) * 60

    paste(
      sprintf("%02d", hh),
      sprintf("%02d", mm),
      sprintf("%04.1f", seconds),
      sep = ":"
    )
}

lat <- params$lat
lon <- params$lon
dates <- seq(ymd("2024-01-11"), ymd("2024-01-17"), 1)

solar_parameters <- map(
  dates,
  function(dte)
    getSunlightTimes(
      dte,
      lat = local(lat), lon = local(lon),
      tz = "US/Alaska"
    )
) |>
  list_rbind() |>
  as_tibble() |>
  mutate(
    day_length = as.numeric(
      difftime(sunset, sunrise, units = "mins")
    ) %% (24 * 60),
    day_length = gsub("\\.0", "", min_to_hhmmss(day_length))
  ) |>
  select(date, sunrise, sunset, day_length, solarNoon)

altitude <- map(
  solar_parameters$solarNoon,
  function(ts)
    getSunlightPosition(ts, lat = local(lat), lon = local(lon))
) |>
  list_rbind() |>
  as_tibble() |>
  mutate(
    date = date(date),
    altitude = rad2deg(altitude)
  ) |>
  select(date, altitude)

sunrise_azimuth <- map(
  solar_parameters$sunrise,
  function(ts)
    getSunlightPosition(ts, lat = local(lat), lon = local(lon))
) |>
  list_rbind() |>
  as_tibble() |>
  mutate(
    date = date(date),
    sunrise_azimuth = (rad2deg(azimuth) - 180) %% 360
  ) |>
  select(date, sunrise_azimuth)

sunset_azimuth <- map(
  solar_parameters$sunset,
  function(ts)
    getSunlightPosition(ts, lat = local(lat), lon = local(lon))
) |>
  list_rbind() |>
  as_tibble() |>
  mutate(
    date = date(date),
    sunset_azimuth = (rad2deg(azimuth) - 180) %% 360
  ) |>
  select(date, sunset_azimuth)

solar_parameters <- solar_parameters |>
  inner_join(altitude, by = "date") |>
  inner_join(sunrise_azimuth, by = "date") |>
  inner_join(sunset_azimuth, by = "date") |>
  mutate(
    across(c(sunrise, sunset, solarNoon), ~ format(.x, "%H:%M:%S"))
  ) |>
  select(
    date, sunrise, sunset, day_length, solar_noon = solarNoon, 
    altitude, sunrise_azimuth, sunset_azimuth
  )

solar_parameters |> 
  gt() |>
  fmt_number(
    columns = c(altitude, sunrise_azimuth, sunset_azimuth),
    decimals = 1
  ) |>
  cols_label(
    date = "Date",
    sunrise = "Sunrise",
    sunset = "Sunset",
    day_length = "Day Length",
    solar_noon = "Solar Noon",
    altitude = "Altitude (°)",
    sunrise_azimuth = "Sunrise (° N)",
    sunset_azimuth = "Sunset (° N)"
  ) |>
  gt_highlight_rows(
    rows = date == ymd("2024-01-14")
  )
Date Sunrise Sunset Day Length Solar Noon Altitude (°) Sunrise (° N) Sunset (° N)
2024-01-11 10:40:02 15:20:44 04:40:42 13:00:23 3.3 147.9 212.4
2024-01-12 10:37:44 15:23:48 04:46:04 13:00:46 3.4 147.3 213.0
2024-01-13 10:35:22 15:26:56 04:51:34 13:01:09 3.6 146.6 213.7
2024-01-14 10:32:55 15:30:08 04:57:13 13:01:31 3.8 145.9 214.4
2024-01-15 10:30:25 15:33:22 05:02:57 13:01:53 3.9 145.2 215.1
2024-01-16 10:27:50 15:36:38 05:08:48 13:02:14 4.1 144.5 215.8
2024-01-17 10:25:12 15:39:58 05:14:46 13:02:35 4.3 143.8 216.5

The highlighted row is the data for today, at our house. Solar noon happens just after 1 PM, and at that point the sun is 3.8 degrees above the horizon of a hypothetical, smooth geoid. Sunrise and sunset on this ellipsoid are at 10:33 and 15:30, giving us a hypothetical day length of four hours and 57 minutes.

But Miller Hill is south of our house, so if the angle between our front window and the top of Miller Hill is higher than 3.8 degrees, we won’t get any direct sun through that window at solar noon. The other issue is that this calculation assumes our elevation above the geoid is zero, so it can’t account for the height of our first floor, or what the sun’s angle will be from the second floor.

Horizon angle

Horizon angle is the angle above the horizon that comes from topography. We can get an estimate of horizon angle by analyzing the data from a digital elevation model. These are raster images where each pixel of the image contains the elevation at that location. It’s only an estimate, and on the ground each pixel represents a rectangular area several meters on a side.

The process is to read in the DEM, draw a series of lines radiating out from our location in all directions, then intersect the lines with the DEM to get a snapshot of the hills and mountains in all directions. Along each of these lines, we calculate the angle between our location (the starting point of the line) and the ground elevation. The maximum angle we find is the horizon angle for that direction at our location. We can also correct for observer height in this calculation by moving the elevation of the start point up.

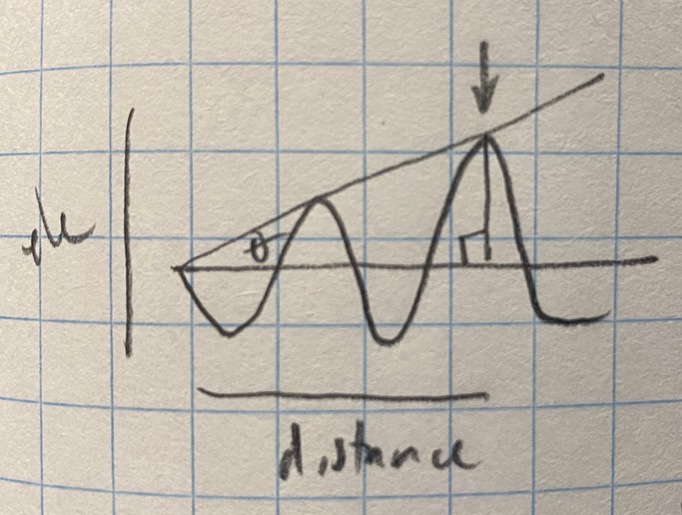
Here’s a diagram of one such elevation line and the horizon angle to the highest hill. The x-axis is distance from our location (on the left), the y-axis is the elevation, and the squiggly line is the topography in that direction. If you move the base of the triangle up slightly and recalculate the angles to the ground, you can see how we can calculate horizon angle at different heights above the ground.

Here’s the code:

Code
library(tidyverse)
library(lubridate)
library(glue)
library(fs)
library(units)
library(terra)
library(sf)
library(furrr)
library(RcppRoll)

deg2rad <- function(deg) {
  return(deg * (pi / 180))
}

rad2deg <- function(rad) {
  return(rad * (180 / pi))
}

st_project_cartesian <- function(point, angle, distance) {
  diff_x <- NA
  diff_y <- NA

  crs <- st_crs(point)

  angle <- angle %% 360
  coordinates <- point %>%
    st_coordinates()
  x <- coordinates[1]
  y <- coordinates[2]

  # Q1
  if ((angle >= 0) && (angle <= 90)) {
    quad_angle <- angle
    diff_x <- distance * sin(deg2rad(quad_angle))
    diff_y <- distance * cos(deg2rad(quad_angle))
  } else if (angle >= 270) {
    # Q2
    quad_angle <- angle - 270
    diff_x <- -1 * distance * cos(deg2rad(quad_angle))
    diff_y <- distance * sin(deg2rad(quad_angle))
  } else if (angle >= 180) {
    # Q3
    quad_angle <- angle - 180
    diff_x <- -1 * distance * sin(deg2rad(quad_angle))
    diff_y <- -1 * distance * cos(deg2rad(quad_angle))
  } else {
    # Q4
    quad_angle <- angle - 90
    diff_x <- distance * cos(deg2rad(quad_angle))
    diff_y <- -1 * distance * sin(deg2rad(quad_angle))
  }

  p_x <- x + diff_x
  p_y <- y + diff_y

  st_as_sf(tibble(x = p_x, y = p_y),
    coords = c("x", "y"),
    crs = crs
  )
}

sf_makeline <- function(points_layer) {
  points_layer |>
    summarize(do_union = FALSE) |>
    st_cast("LINESTRING")
}

plan(multisession, workers = 6, gc = TRUE)
options(future.rng.onMisuse = "ignore") # not using random numbers
options(future.globals.maxSize = 2048 * 1024^2)

# Already projected to cartesian coordinate system. Use terra::project
# or gdalwarp -t_srs EPSG:32606 -r bilinear dem.tif dem_srs.tif
dem <- rast("fbks_blocks_ft_32606.tif")

# Allows us to serialize; necessary for parallel operations
dem_wrap <- wrap(dem)

lat <- params$lat
lon <- params$lon
CRS <- params$crs

start_point <- st_as_sf(
  tibble(x = lon, y = lat),
  coords = c("x", "y"),
  crs = 4326
) |>
  st_transform(CRS)

get_horizon_angle <- function(
  angle, distance, start_point, wrapped_dem,
  height_m = 0, return_vector = FALSE
) {
  dem <- unwrap(wrapped_dem)

  end_point <- st_project_cartesian(
    start_point, angle, distance
  )

  vector <- bind_rows(start_point, end_point) |>
    sf_makeline()

  vector_points <- vector |>
    st_segmentize(dfMaxLength = 5) |>
    st_coordinates() |>
    as_tibble() |>
    select(X, Y) |>
    st_as_sf(coords = c("X", "Y"), crs = CRS) |>
    mutate(
      distance = st_distance(lag(geometry), geometry, by_element = TRUE),
      distance = as.numeric(set_units(distance, "ft")),
      distance = coalesce(distance, 0),
      distance = cumsum(distance)
    ) |>
    filter(distance == 0 | distance > 100)

  elevations <- terra::extract(dem, vector_points)

  vector_points$dem_elevation <- elevations |>
    pull(contains("ft"))

  starting_elevation <- vector_points$dem_elevation[1] + height_m

  horizon_angles <- vector_points |>
    mutate(horizon_angle = map2_dbl(
      vector_points$distance, vector_points$dem_elevation,
      function(dist, ele) rad2deg(asin((ele - starting_elevation) / dist))
    ))

  if (return_vector) {
    return(horizon_angles)
  } else {
    return(
      horizon_angles |>
        filter(!is.nan(horizon_angle)) |>
        summarize(max_angle = max(horizon_angle)) |>
        pull(max_angle)
    )
  }
  horizon_angle
}

all_horizon_angles <- tibble(azimuth = seq(0, 359)) |>
  mutate(
    horizon_angle = future_map_dbl(
      azimuth,
      function(angle)
        get_horizon_angle(angle, 1609 * 5, start_point, dem_wrap)
    )
  )

smoothed_horizon_angles <- all_horizon_angles |>
  bind_rows(
    all_horizon_angles |>
      mutate(azimuth = azimuth - 360),
    all_horizon_angles |>
      mutate(azimuth = azimuth + 360)
  ) |>
  arrange(azimuth) |>
  mutate(
    horizon_angle_smooth = roll_mean(
      horizon_angle,
      n = 5, fill = NA, align = "center"
    )
  ) |>
  filter(azimuth >= 0, azimuth <= 359)

write_csv(smoothed_horizon_angles, "horizon_angles.csv")

A few important notes about the code. The DEM needs to be converted from the latitude/longitude projection of the original data into a projection that flattens the area into a Cartesian coordinate system where the x and y coordinates are square. This allows us to create lines radiating out from our location at all angles using simple trigonometry (see the st_project_cartesian function in the code). These calculations can also be done using spherical math (see the destPoint function from the geosphere package), but we didn’t do that here.

We also perform the calculations starting 100 meters from the center location because minor elevation changes between the center location raster pixel and pixels nearby would result in the same horizon angle for unrealistic ranges of directions. I also smoothed the horizon angles slightly.

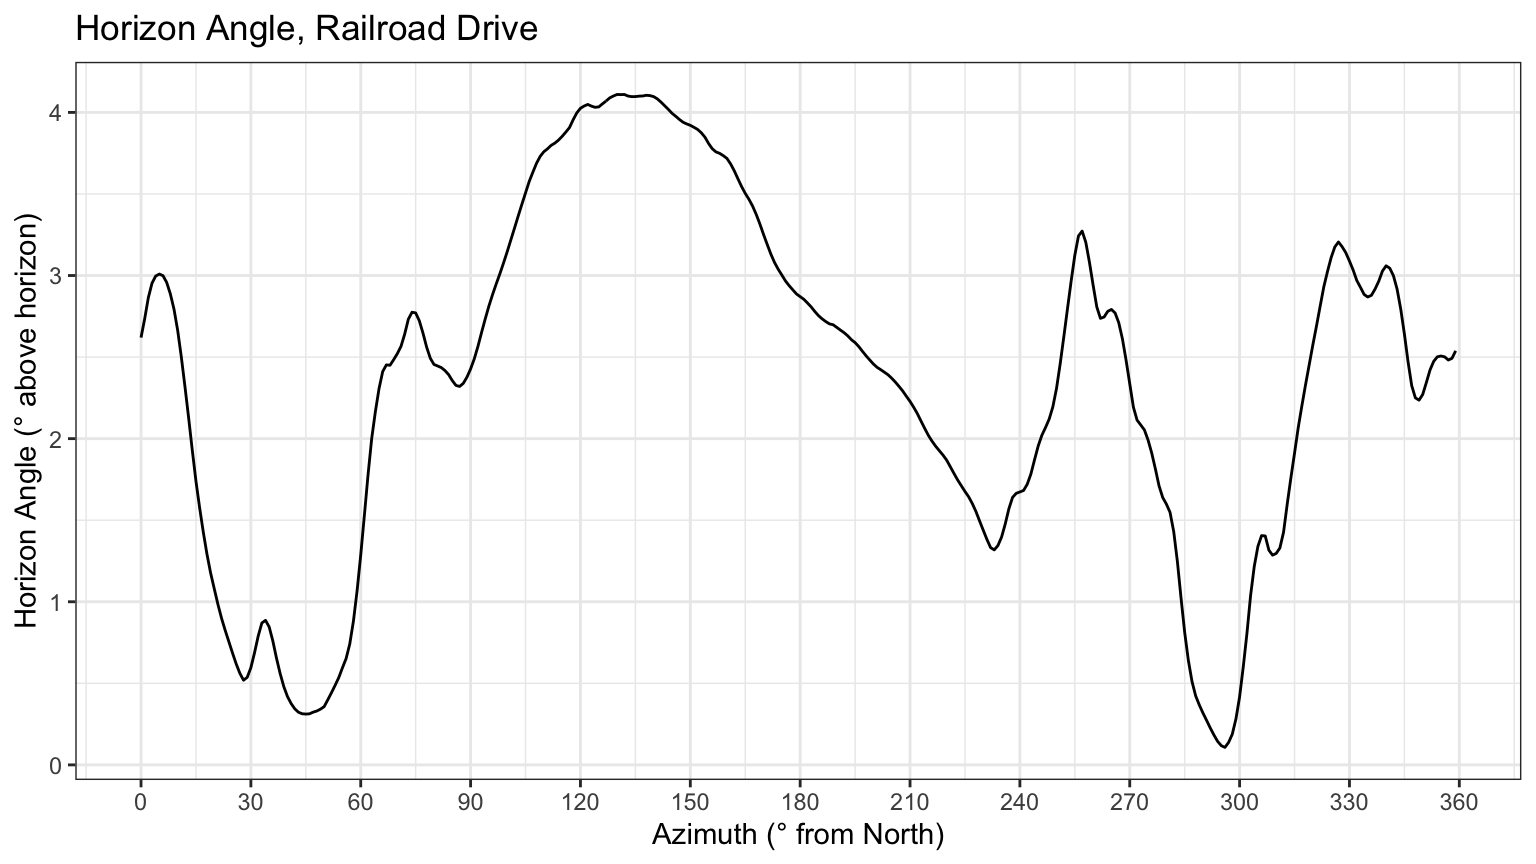
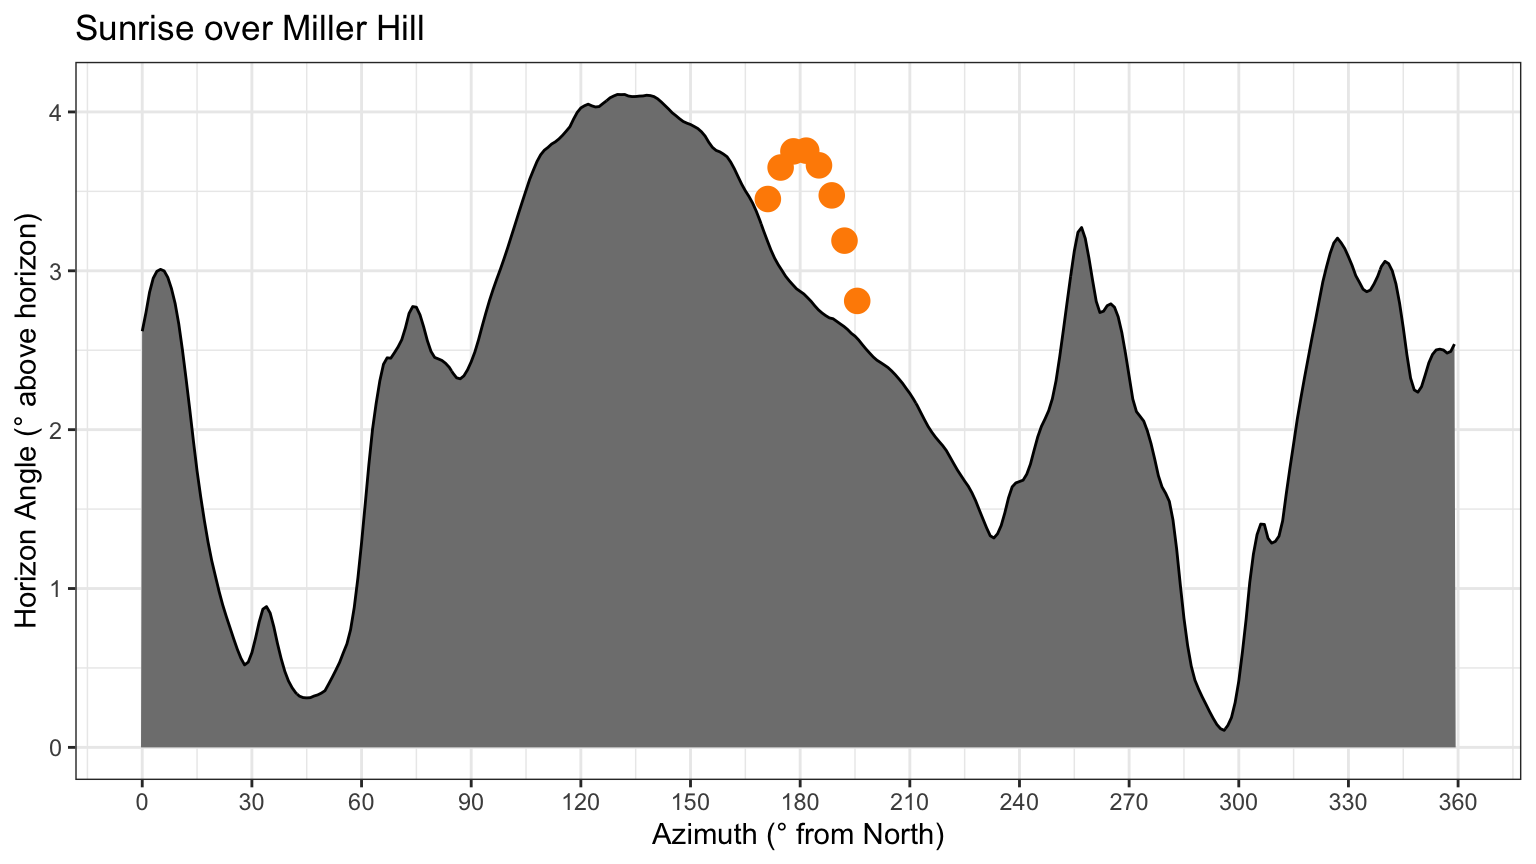
Here’s a look at the horizon angles for our house (at the ground level). The plot has north on the left (0 degrees) and right (360 degrees) sides of the plot, and south (180 degrees) in the middle.

Code
library(scales)
ggplot(
  data = smoothed_horizon_angles,
  aes(x = azimuth, y = horizon_angle_smooth)
) +
  theme_bw() +
  geom_line() +
  scale_x_continuous(
    name = "Azimuth (° from North)",
    breaks = seq(0, 360, 30)
  ) +
  scale_y_continuous(
    name = "Horizon Angle (° above horizon)",
    breaks = pretty_breaks(n = 5)
  ) +
  labs(title = "Horizon Angle, Railroad Drive")

You can see Miller Hill between 60 and 210 degrees, and the other peaks are Ester Dome (255 degrees) and Murphy Dome (330). At solar noon on today’s date, the sun is supposed to be 3.8 degrees above the horizon, and the horizon angle at 180 degrees is 2.9 degrees, so theoretically we should get direct sunlight at solar noon. The sun itself is 0.833 degrees “tall”, which means that the entire area of the sun will be just above the horizon at that time.

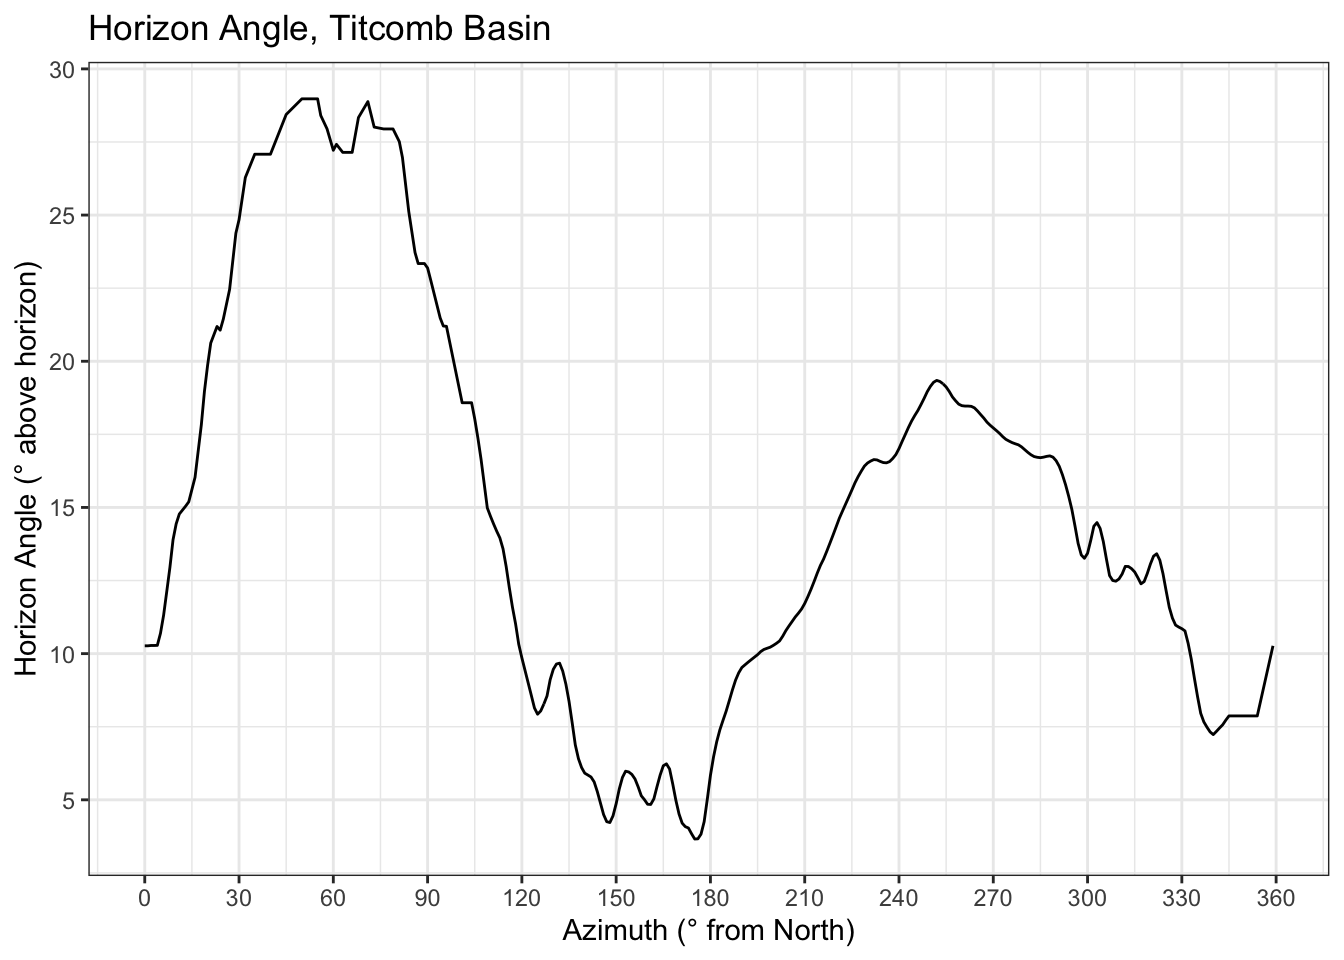
Here’s the horizon angles for our campsite at Titcomb Basin. Look at how steep the horizon angles are!

Sun over the horizon

Now let’s intersect the sun’s position against the horizon angle. To do that, we need to calculate the sun angles and compass directions from sunrise to sunset and plot these against the horizon angles.

Here’s the plot with the same horizon angles, and the sun’s position plotted in orange.

Code
today_sun <- getSunlightTimes(
  ymd("2024-01-14"),
  lat = lat, lon = lon,
  tz = "US/Alaska"
)
sun_times <- seq(
  today_sun$sunrise + minutes(5),
  today_sun$sunset - minutes(5),
  15 * 60
)
sun_position <- map(
  sun_times,
  function(ts)
    getSunlightPosition(ts, lat = local(lat), lon = local(lon))
) |>
  list_rbind() |>
  filter(altitude > 0) |>
  mutate(
    altitude = rad2deg(altitude),
    azimuth = (rad2deg(azimuth) - 180) %% 360
  ) |>
  as_tibble() 

ggplot(
  data = smoothed_horizon_angles,
  aes(x = azimuth, y = horizon_angle_smooth)
) +
  theme_bw() +
  geom_point(
    data = sun_position,
    aes(x = azimuth, y = altitude),
    color = "darkorange",
    size = 4
  ) +
  geom_area(color = "black", fill = "grey50") +
  scale_x_continuous(
    name = "Azimuth (° from North)",
    breaks = seq(0, 360, 30)
  ) +
  scale_y_continuous(
    name = "Horizon Angle (° above horizon)",
    breaks = pretty_breaks(n = 5)
  ) +
  labs(title = "Sunrise over Miller Hill")

From this, we can calculate when the sun is above the horizon for today’s date. The highlighted rows are where the full disc of the sun is above the horizon.

Code
smoothed_horizon_angles |>
  inner_join(
    sun_position |>
      mutate(azimuth = as.integer(round(azimuth))),
    by = "azimuth"
  ) |>
  filter(altitude > horizon_angle) |>
  mutate(
    time = format(date, "%H:%M:%S"),
    degrees_above_horizon = altitude - horizon_angle
  ) |>
  select(time, azimuth, altitude, degrees_above_horizon) |>
  gt() |>
  fmt_number(
    columns = c(altitude, degrees_above_horizon),
    decimals = 2
  ) |>
  cols_label(
    time = "Time",
    azimuth = "Position (° N)",
    altitude = "Altitude (°)",
    degrees_above_horizon = "Above Horizon (°)",
  ) |>
  gt_highlight_rows(
    rows = degrees_above_horizon > 0.833
  )
Time Position (° N) Altitude (°) Above Horizon (°)
12:22:55 171 3.45 0.27
12:37:55 175 3.65 0.64
12:52:55 178 3.75 0.86
13:07:55 182 3.76 0.92
13:22:55 185 3.66 0.90
13:37:55 189 3.47 0.78
13:52:55 192 3.19 0.56
14:07:55 196 2.81 0.24